DATA VISUALIZATION
Public Data on Various Platforms

Turn quantity raw data into quality insight. Considering various approaches and techniques help us communicate with and influence others.
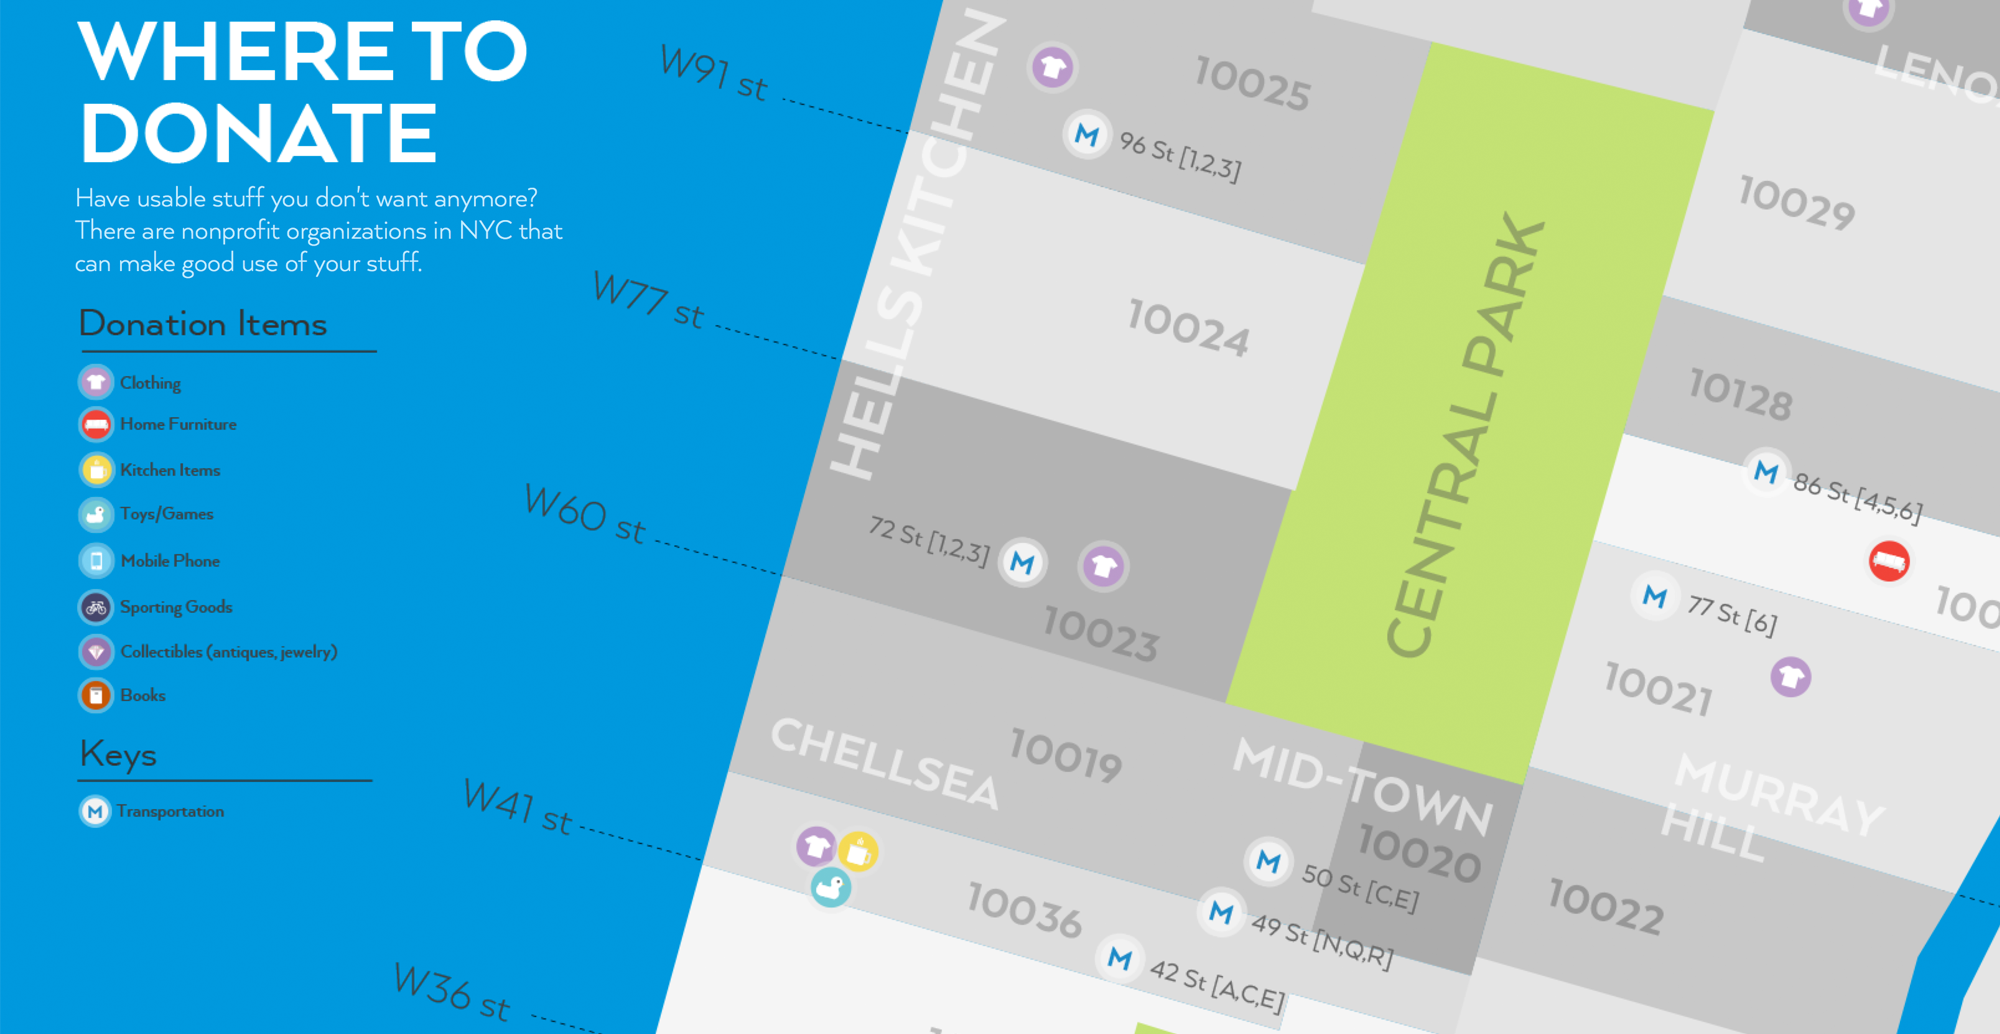
Where to donate
Interactive map
Donate your unfrequently used appliances, clothing, furniture, household goods and other items. Interactive New York City map for nonprofit organizations donation places.
View the interactive map
Global Peace Index
Installation
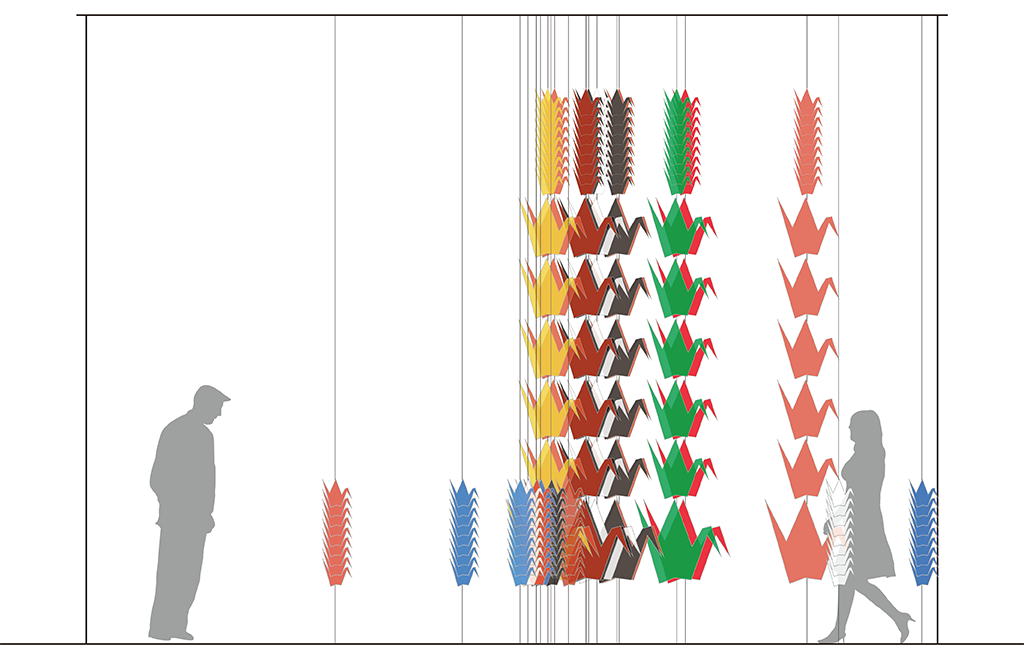
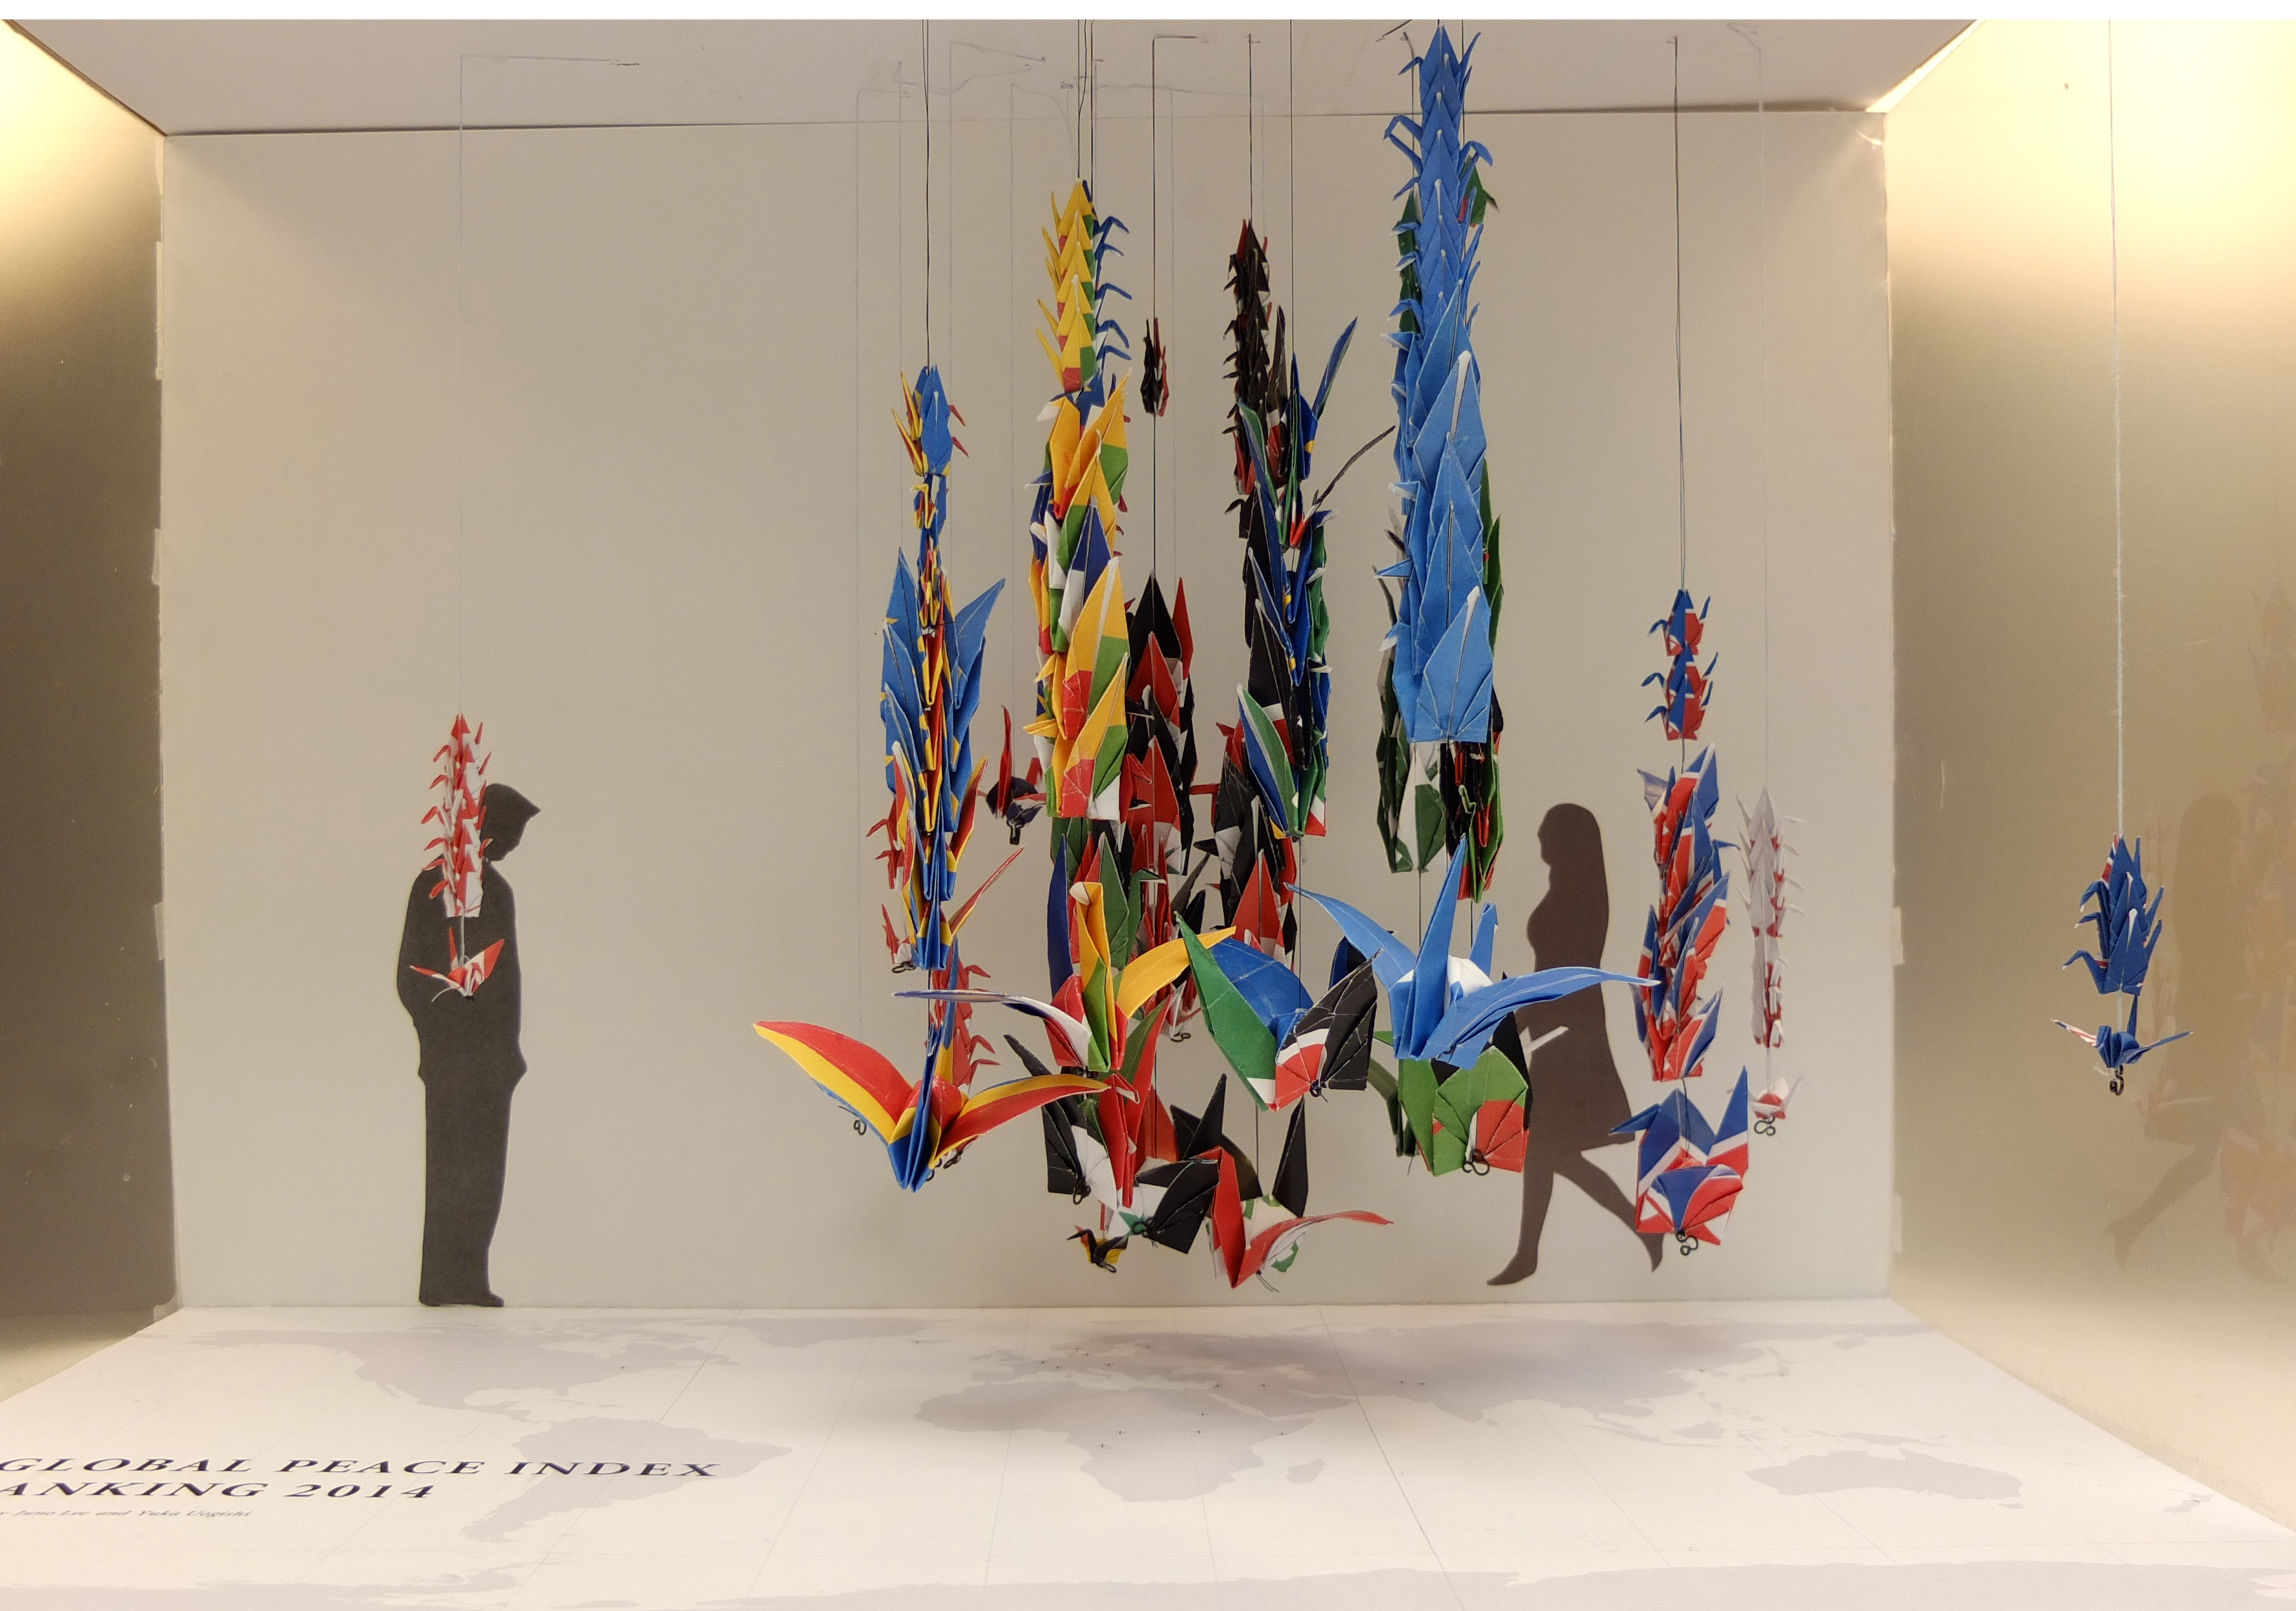
The Global Peace Index (GPI) is an attempt to measure the relative position of nations' and regions' peacefulness.
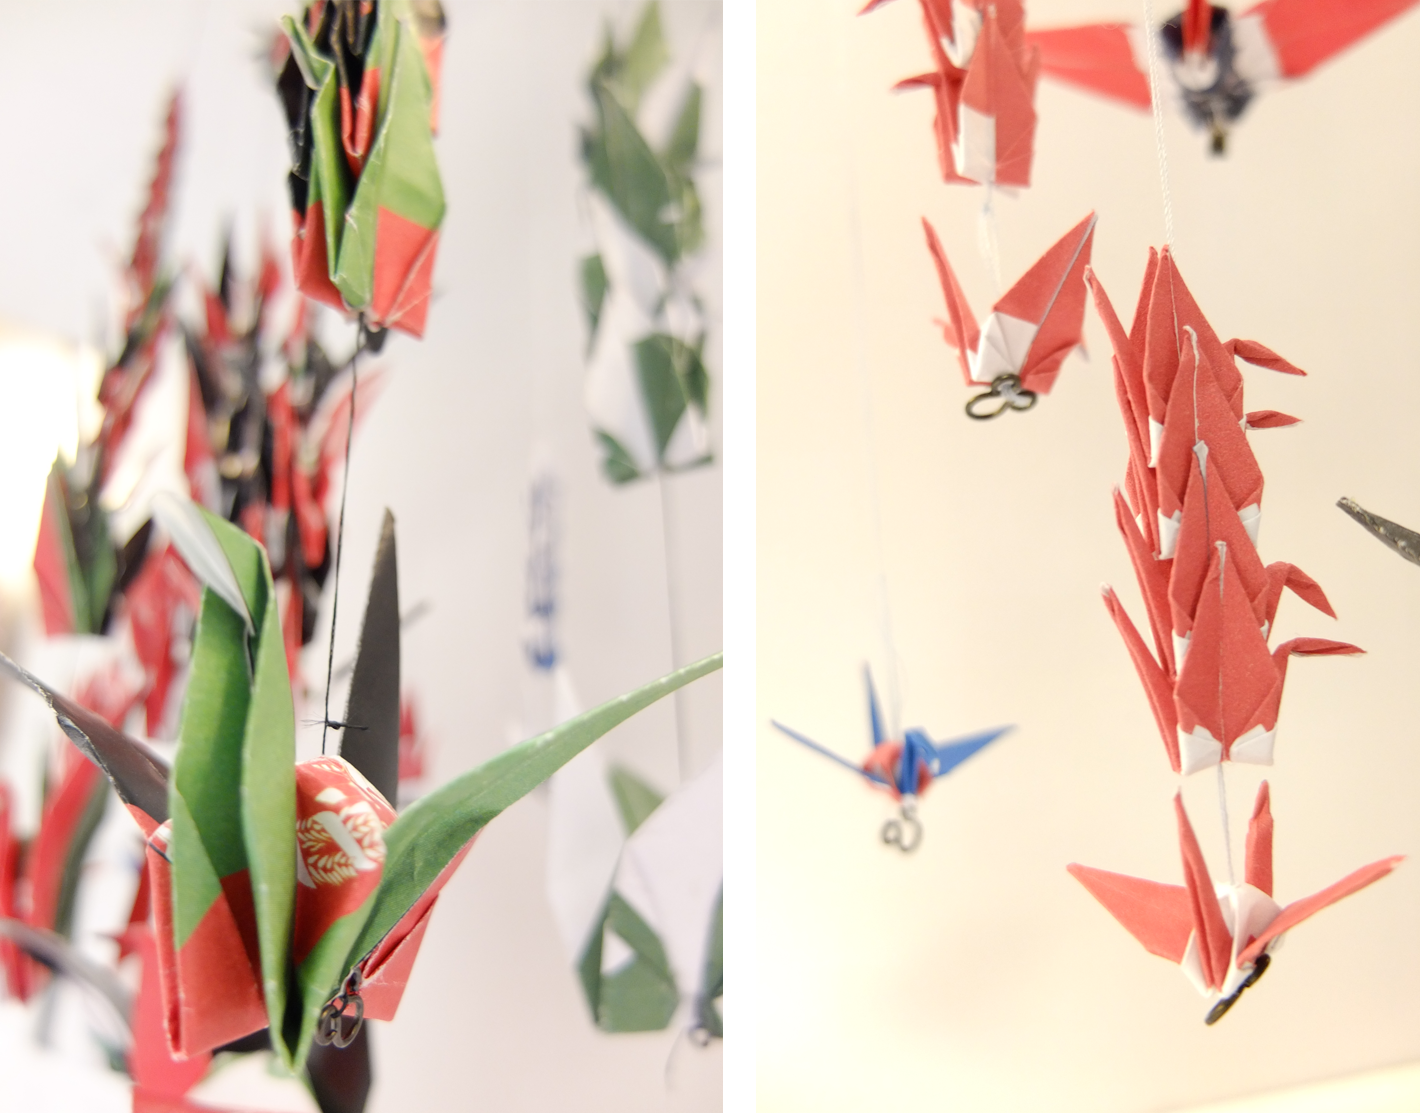
Metaphor— An ancient Japanese legend promises that anyone who folds a thousand origami cranes will be granted a wish by a crane. Some stories believe you are granted eternal good luck, instead of just one wish, such as long life or recovery from illness or injury. At Japanese temples and tragic places such as Hiroshima peace memorial park, school groups or individuals often donate thousand origami cranes which is a group of one thousand origami paper cranes held together by strings to add to the prayer for peace.
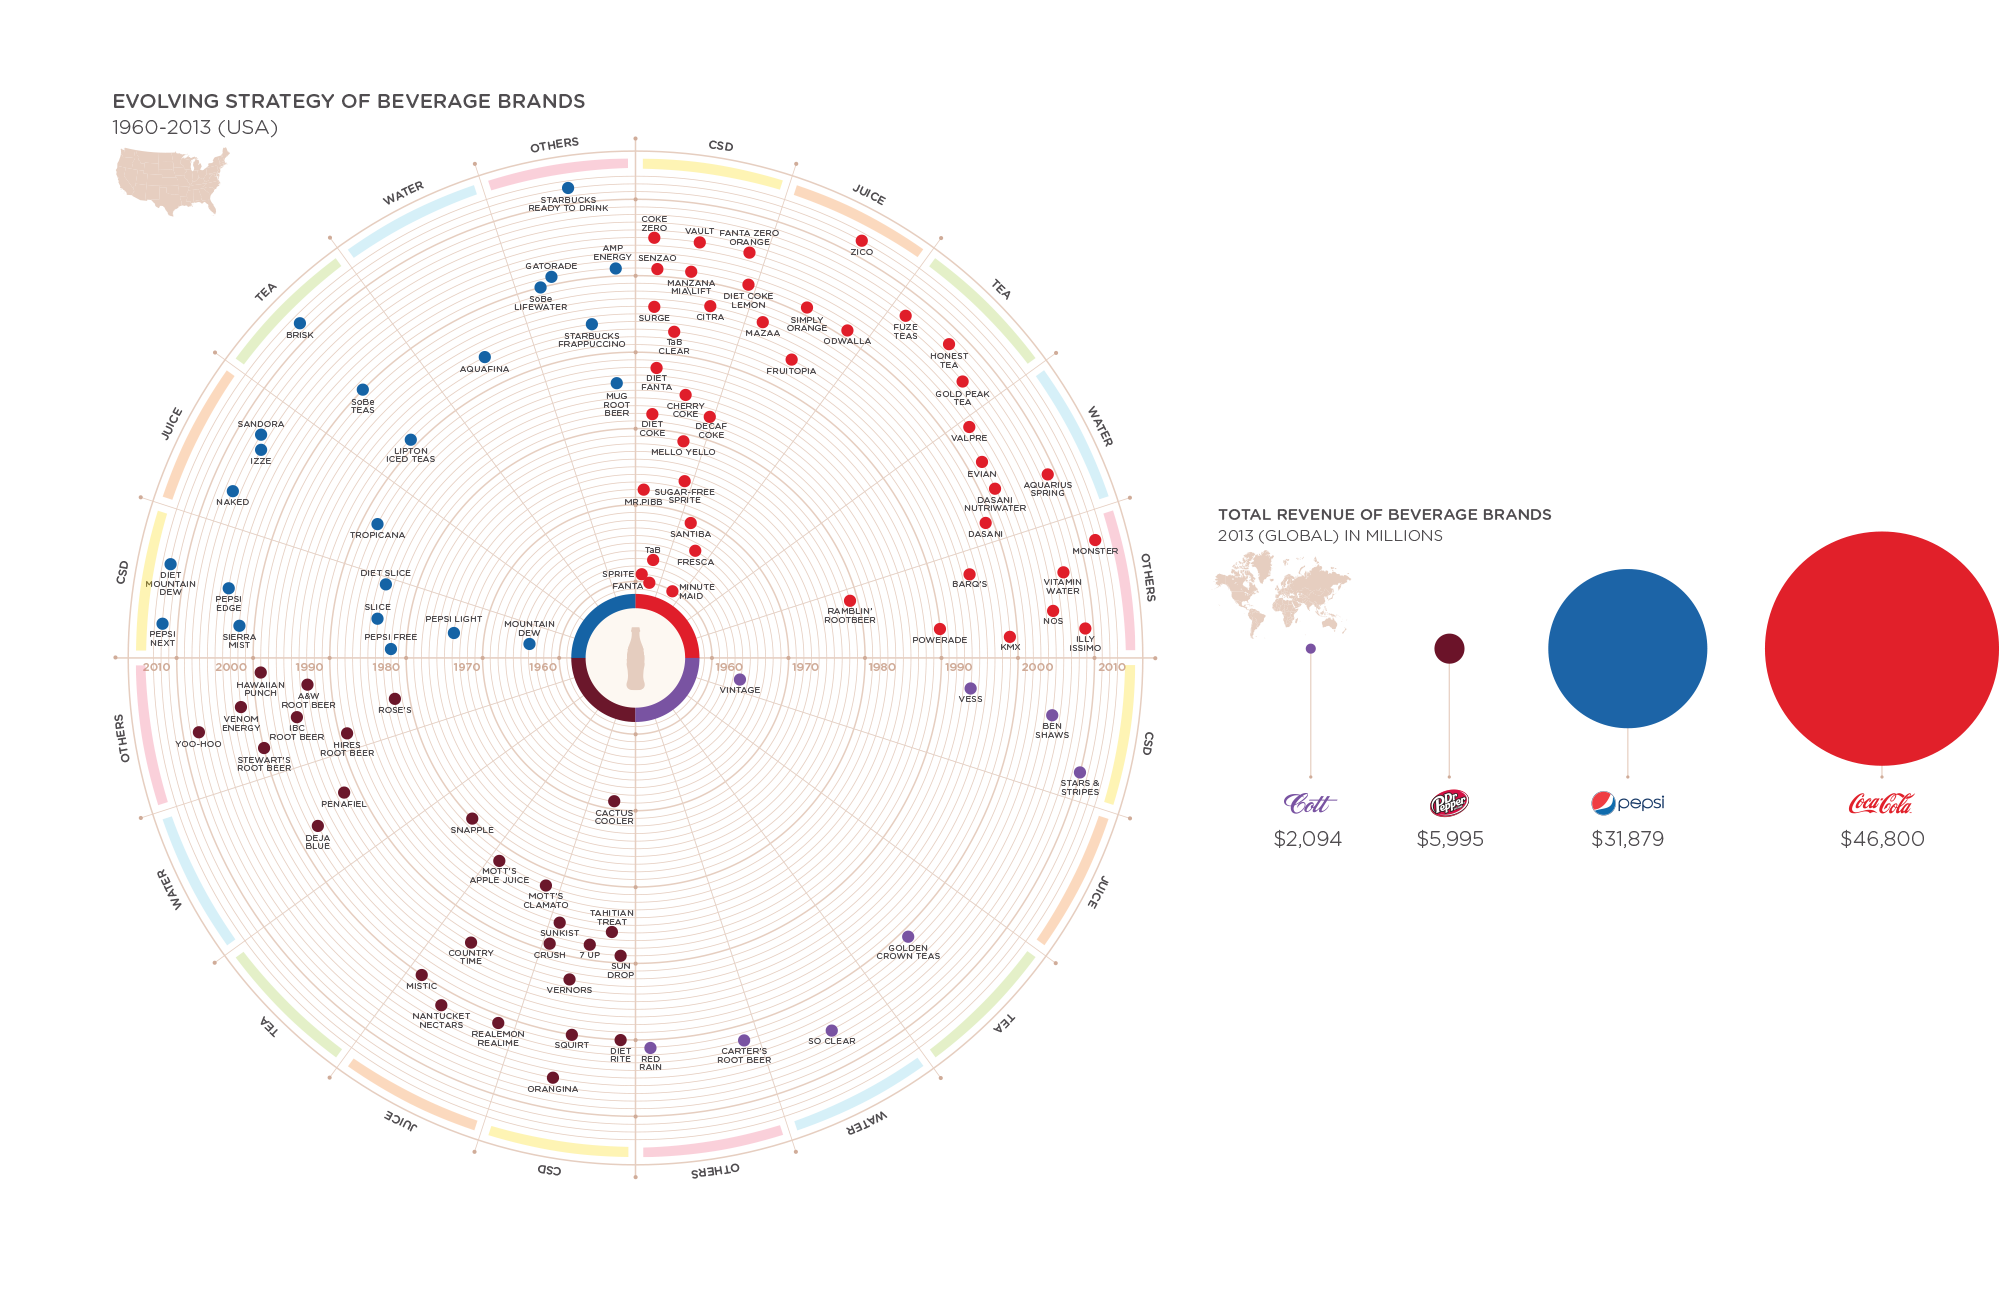
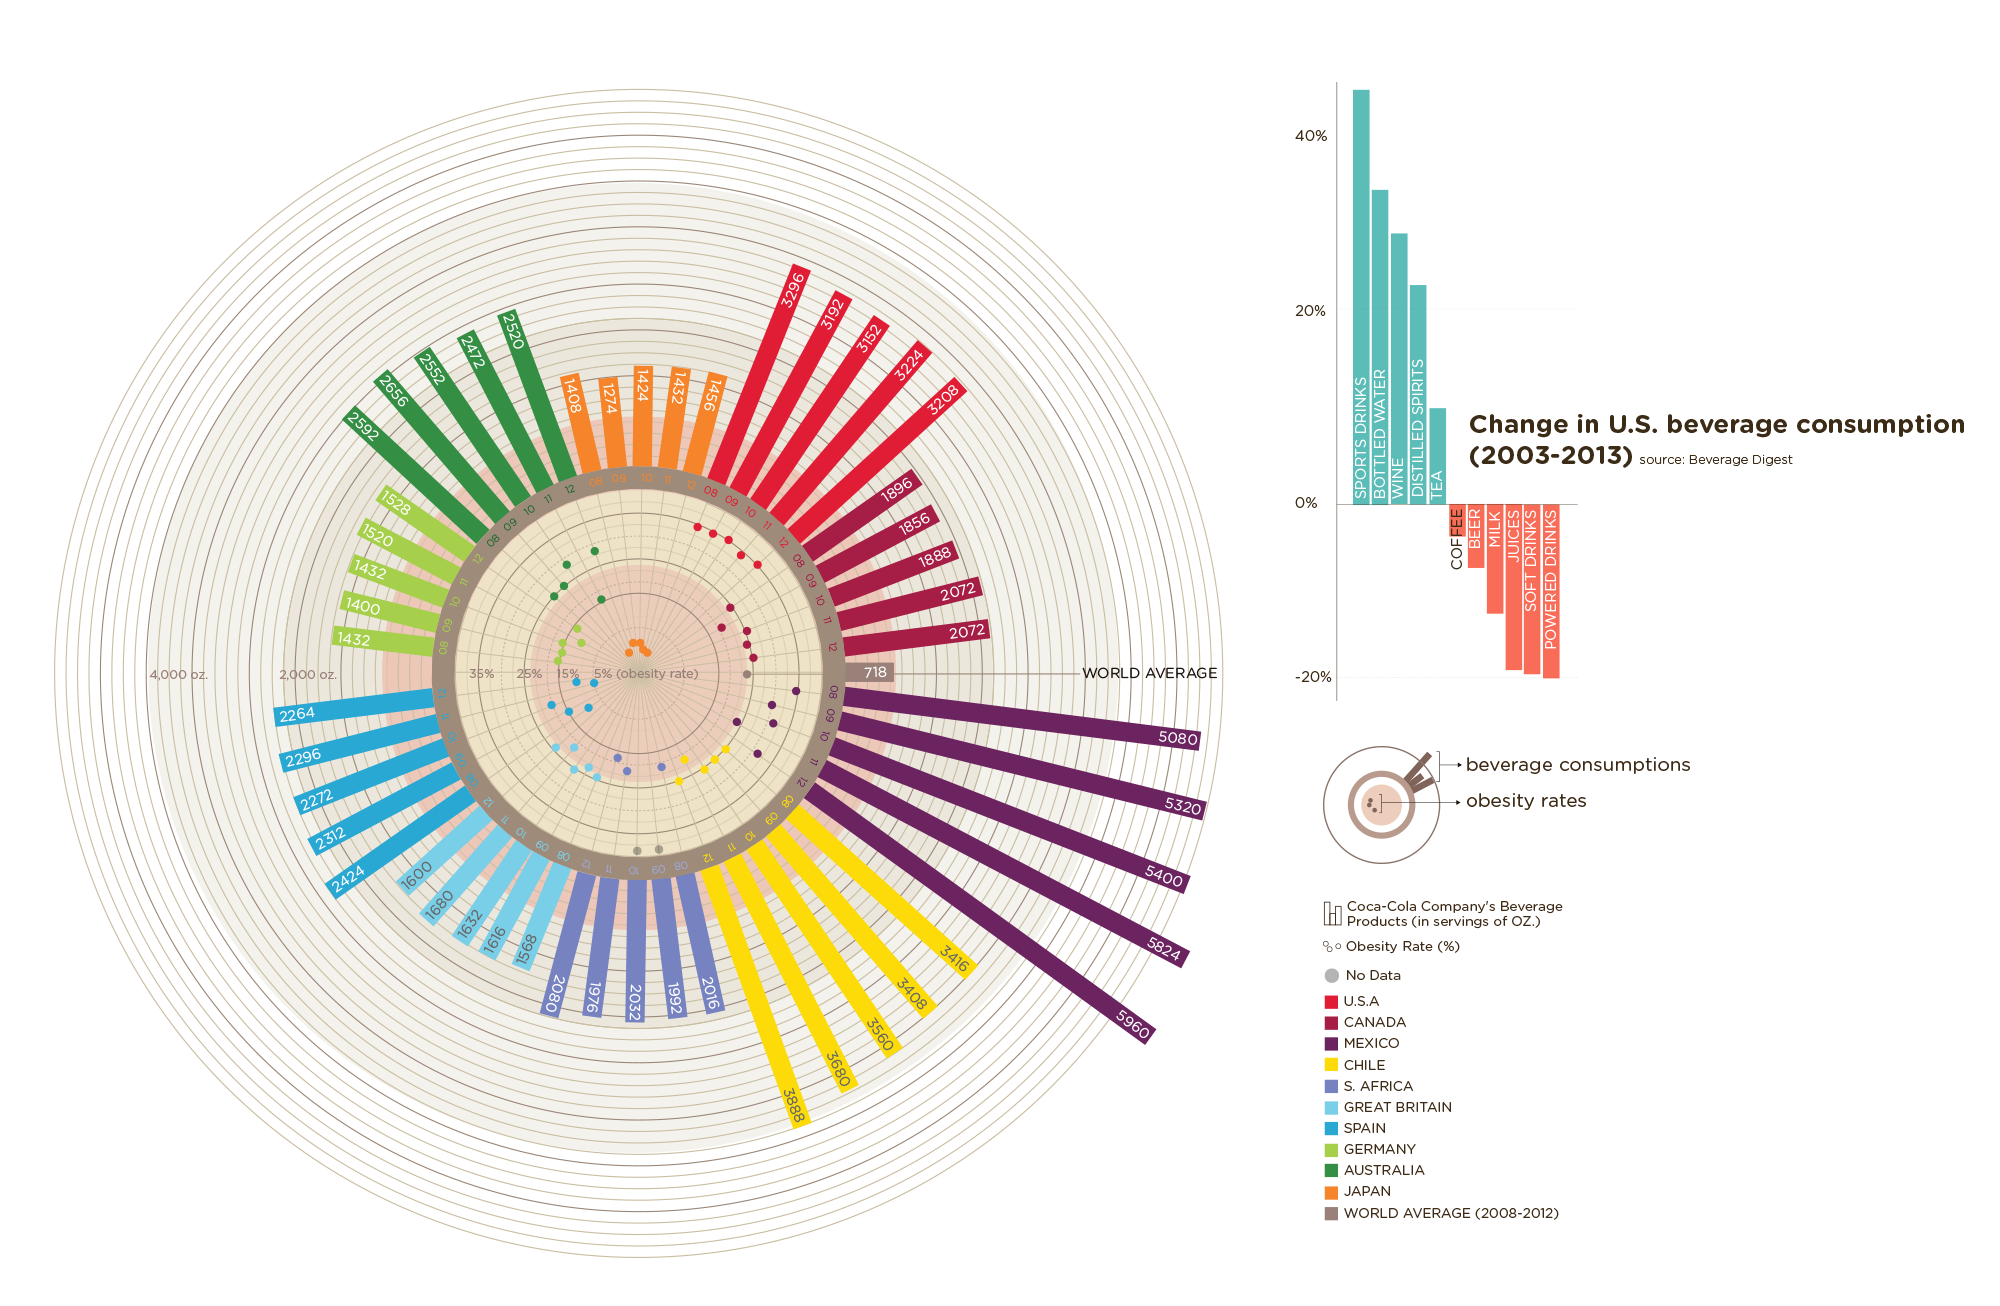
Beverage products and obesity rate by country
Annual per capita consumption of Coca-Cola and other big 3 company's beverage products and obesity rate by country (2008-2012). Look up annual reports of 4 different companies in one industry and compare and find insights in 4 criteria and visualize.
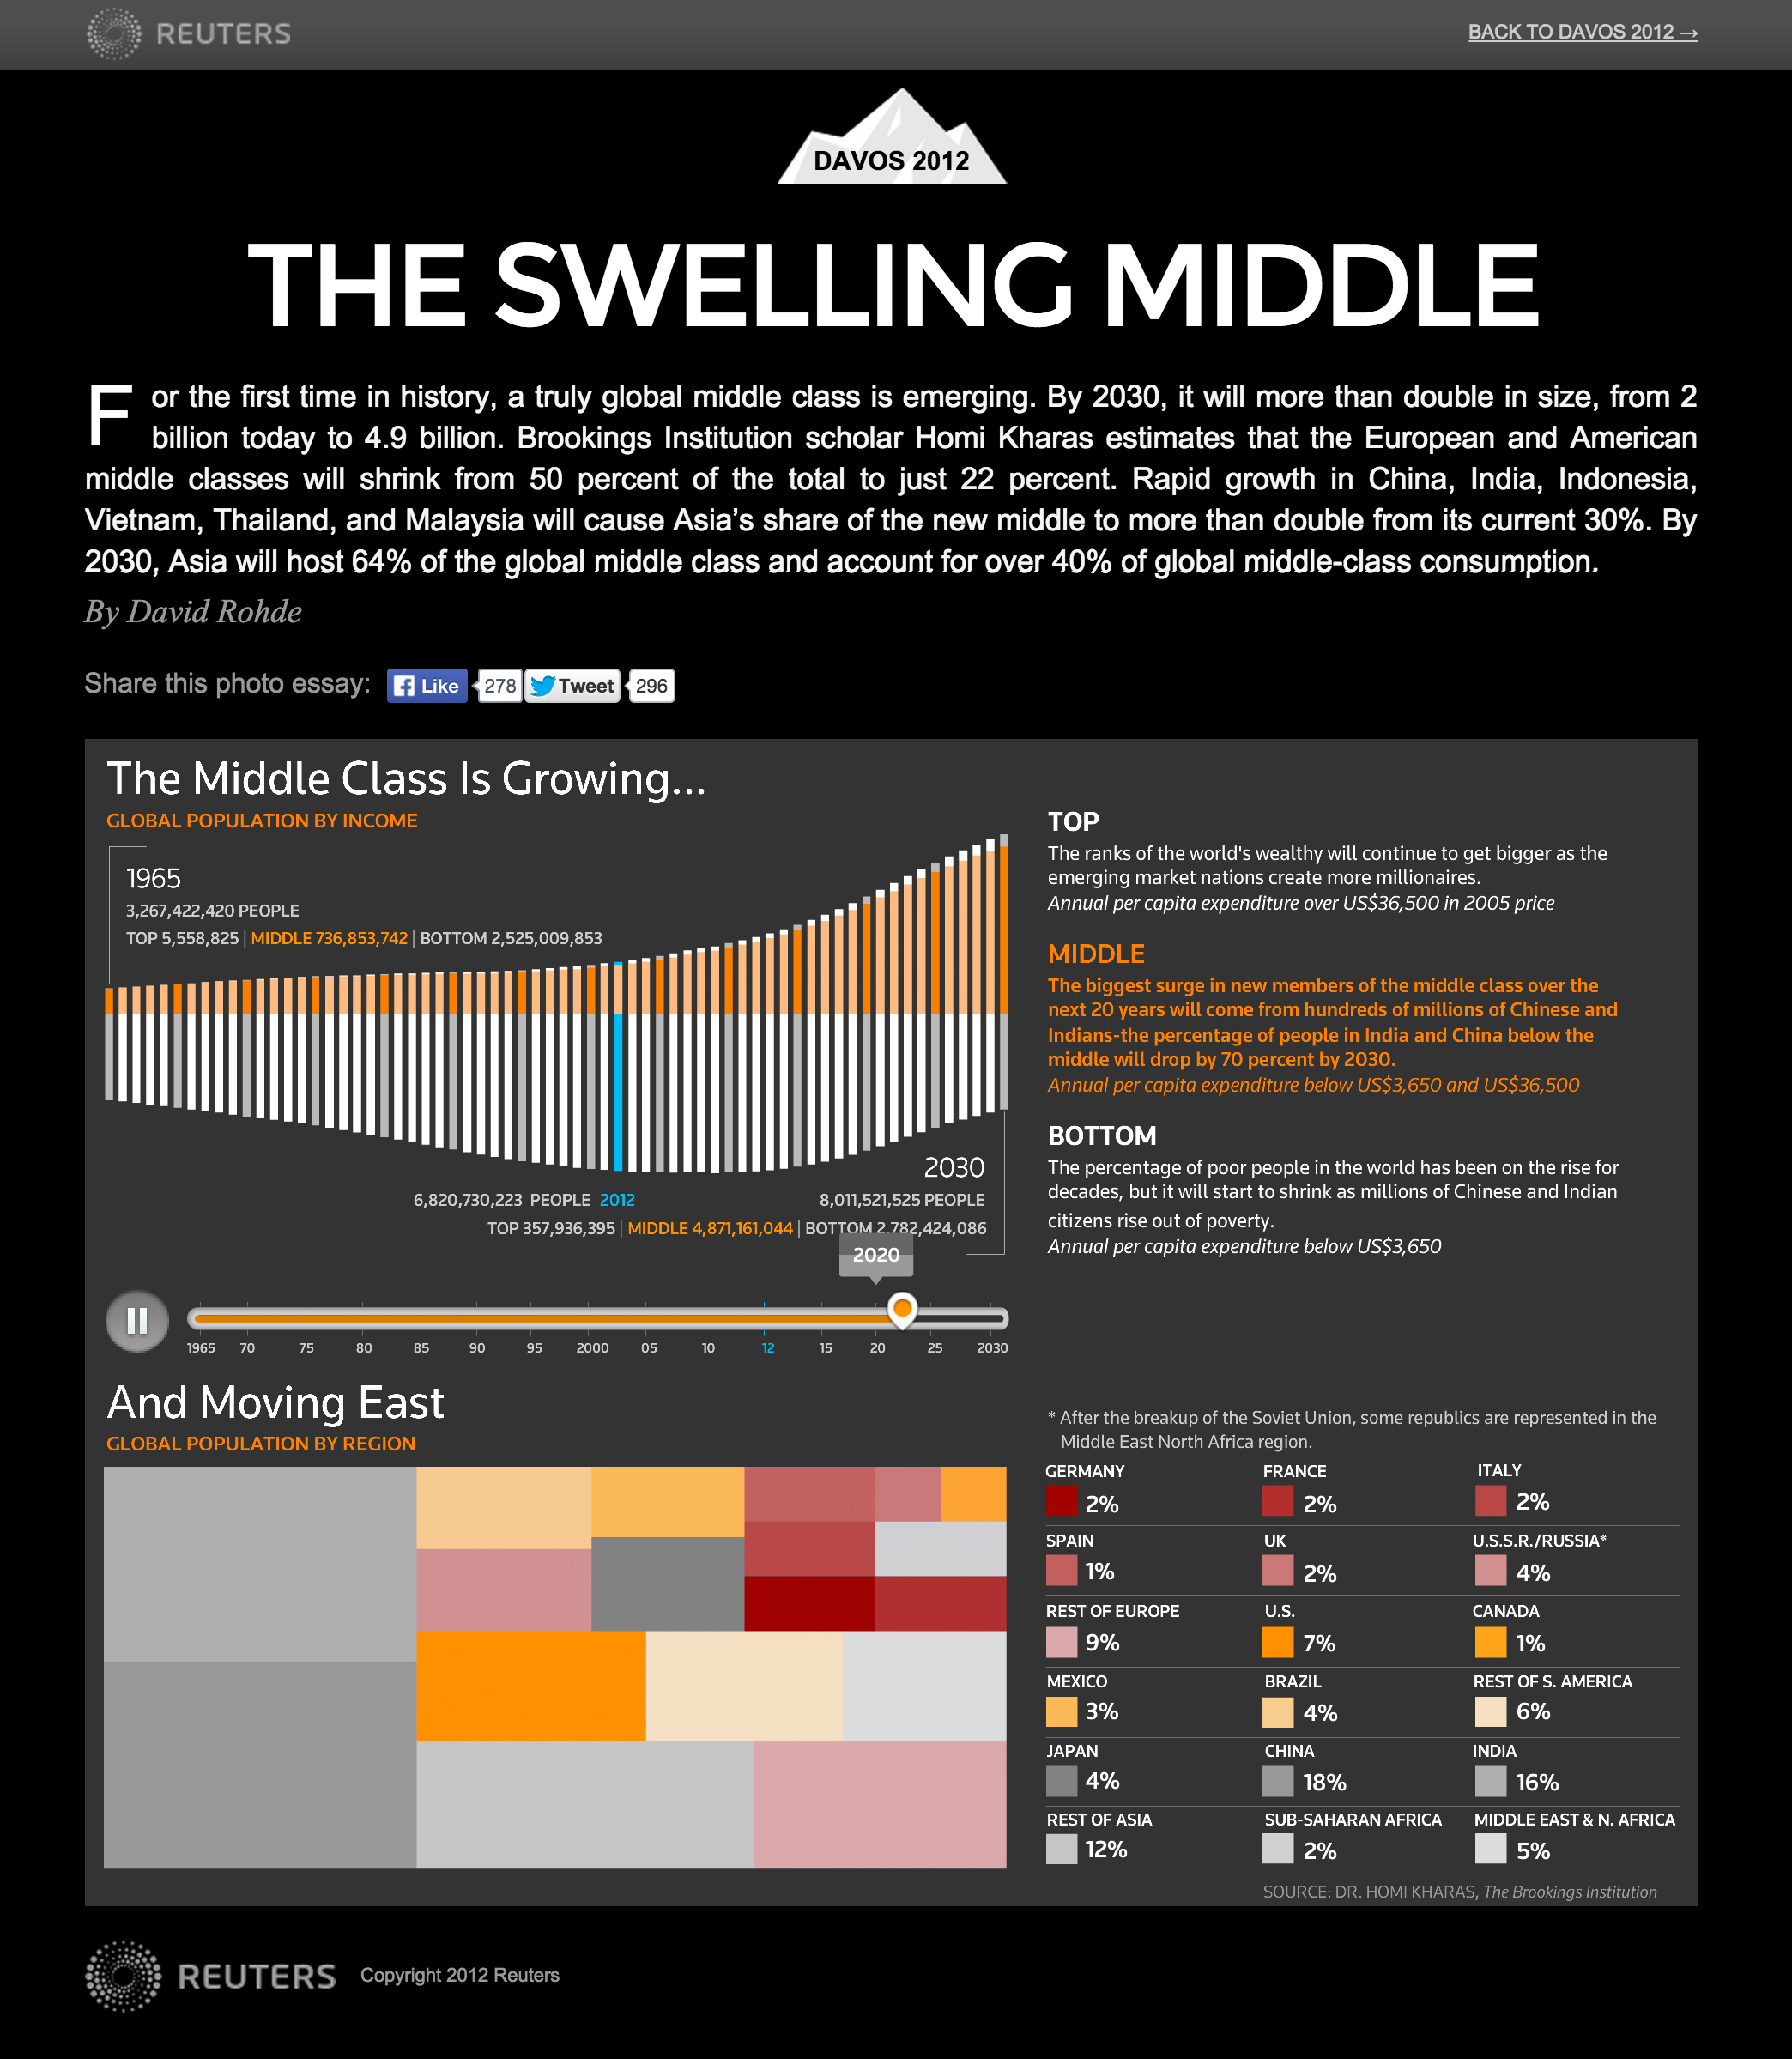
The Swelling Middle Class
Interactive chart
By 2030, the middle class will more than double in size, from 2 billion today to 4.9 billion. Brookings Institution scholar Homi Kharas estimates that the European and American middle classes will shrink from 50% of the total to just 22%. Rapid growth in China, India, Indonesia, Vietnam, Thailand, and Malaysia will cause Asia’s share of the new middle to more than double from its current 30%. By 2030, Asia will host 64% of the global middle class and account for over 40% of global middle-class consumption.
